Inflation & Interest Rates

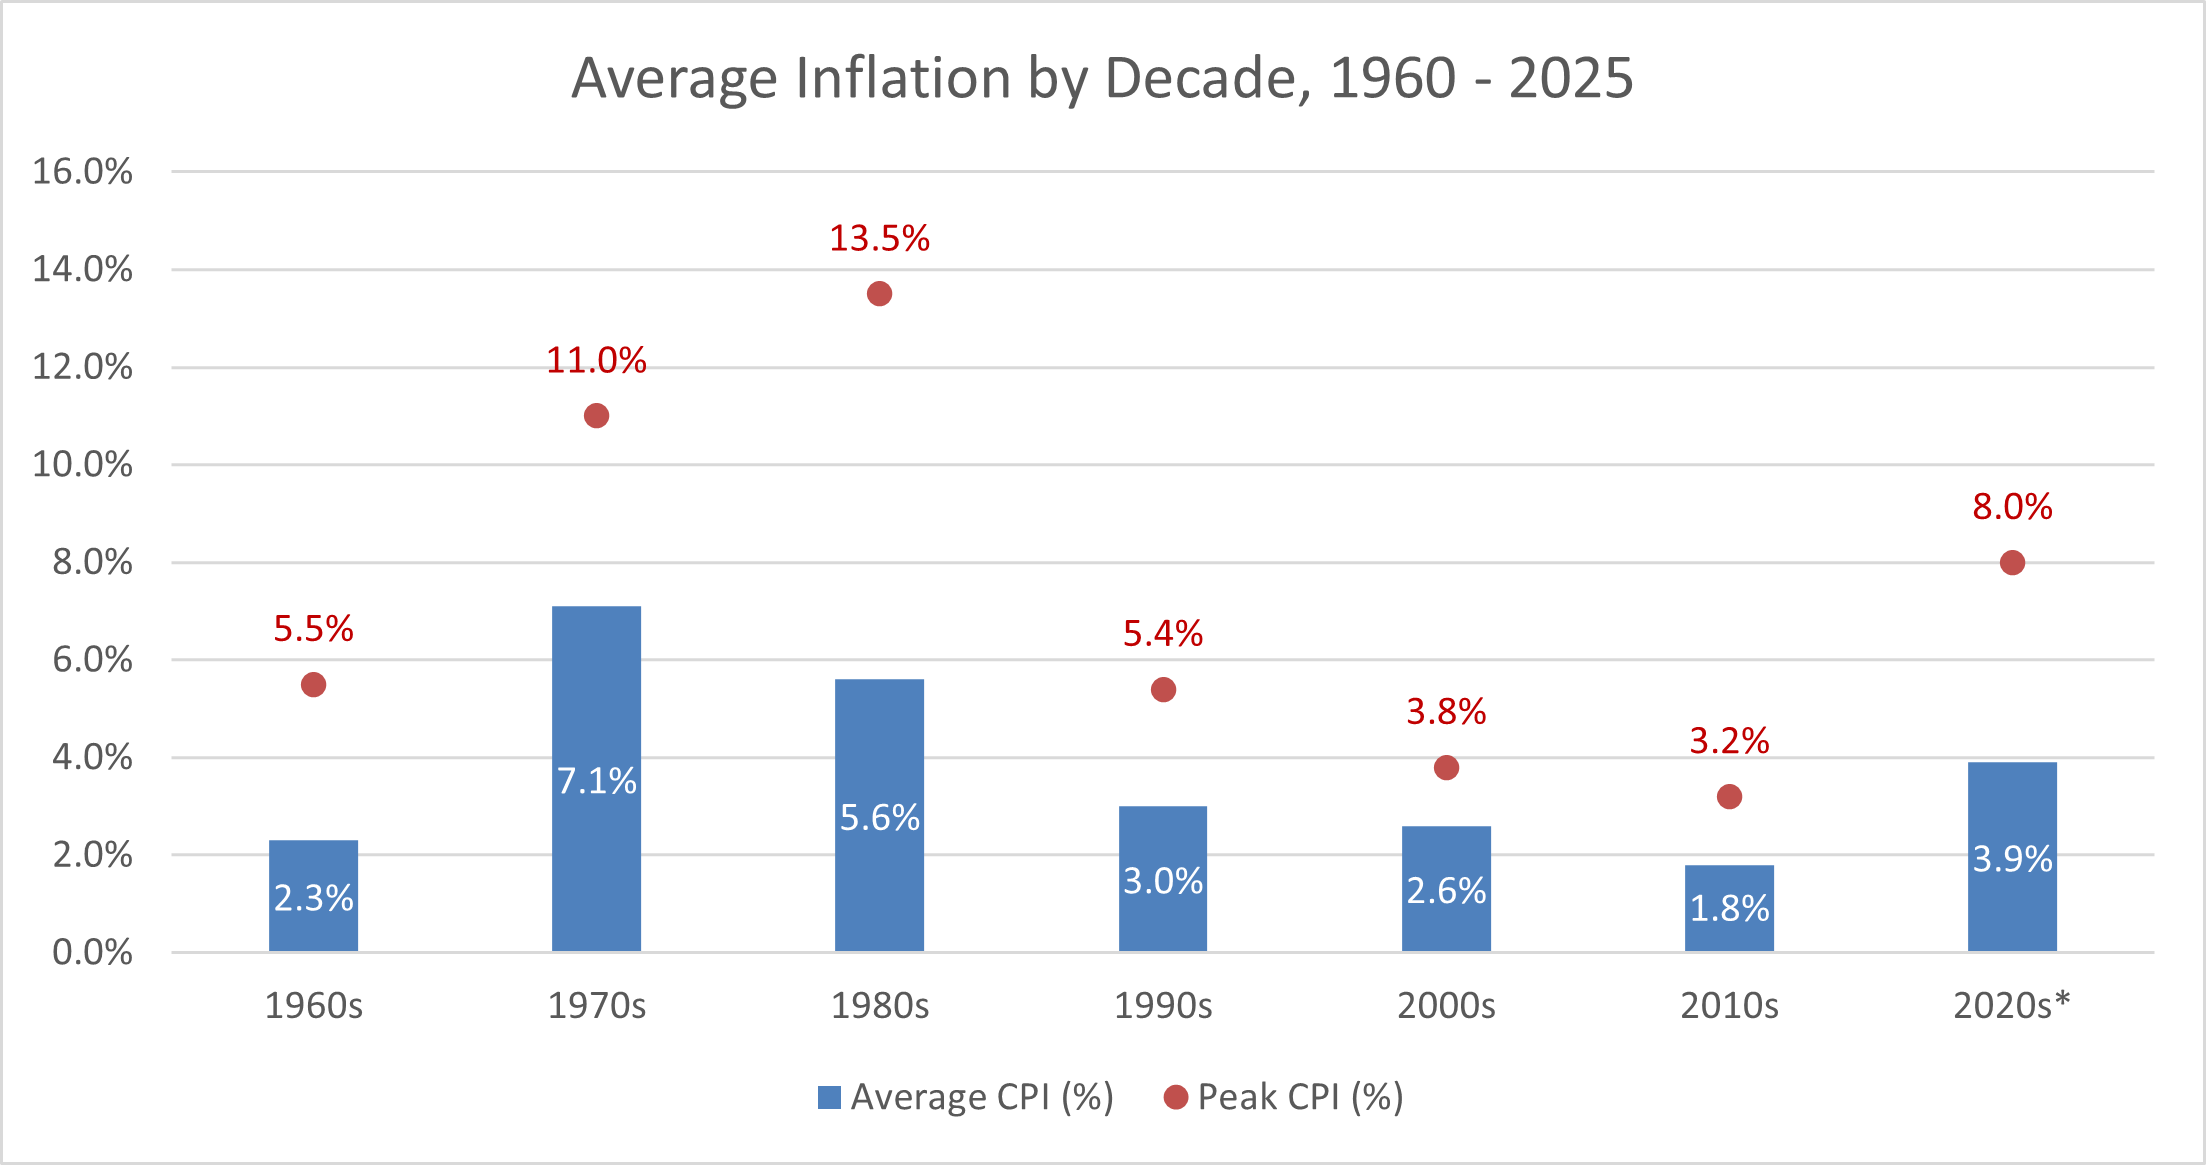
Political drama surrounds the Federal Reserve's course on interest rates in 2026 as economic experts debate whether our current monetary landscape is more similar to the volatile and inflationary 1970’s or the smooth disinflation of the first 20 years of the 2000’s. This section provides the reader with a brief recent history of U.S. inflation, adds context to the factors governing current and future inflation and interest rates, and offers tools to understand new data related to these metrics as well as cap rates and real estate values going forward.

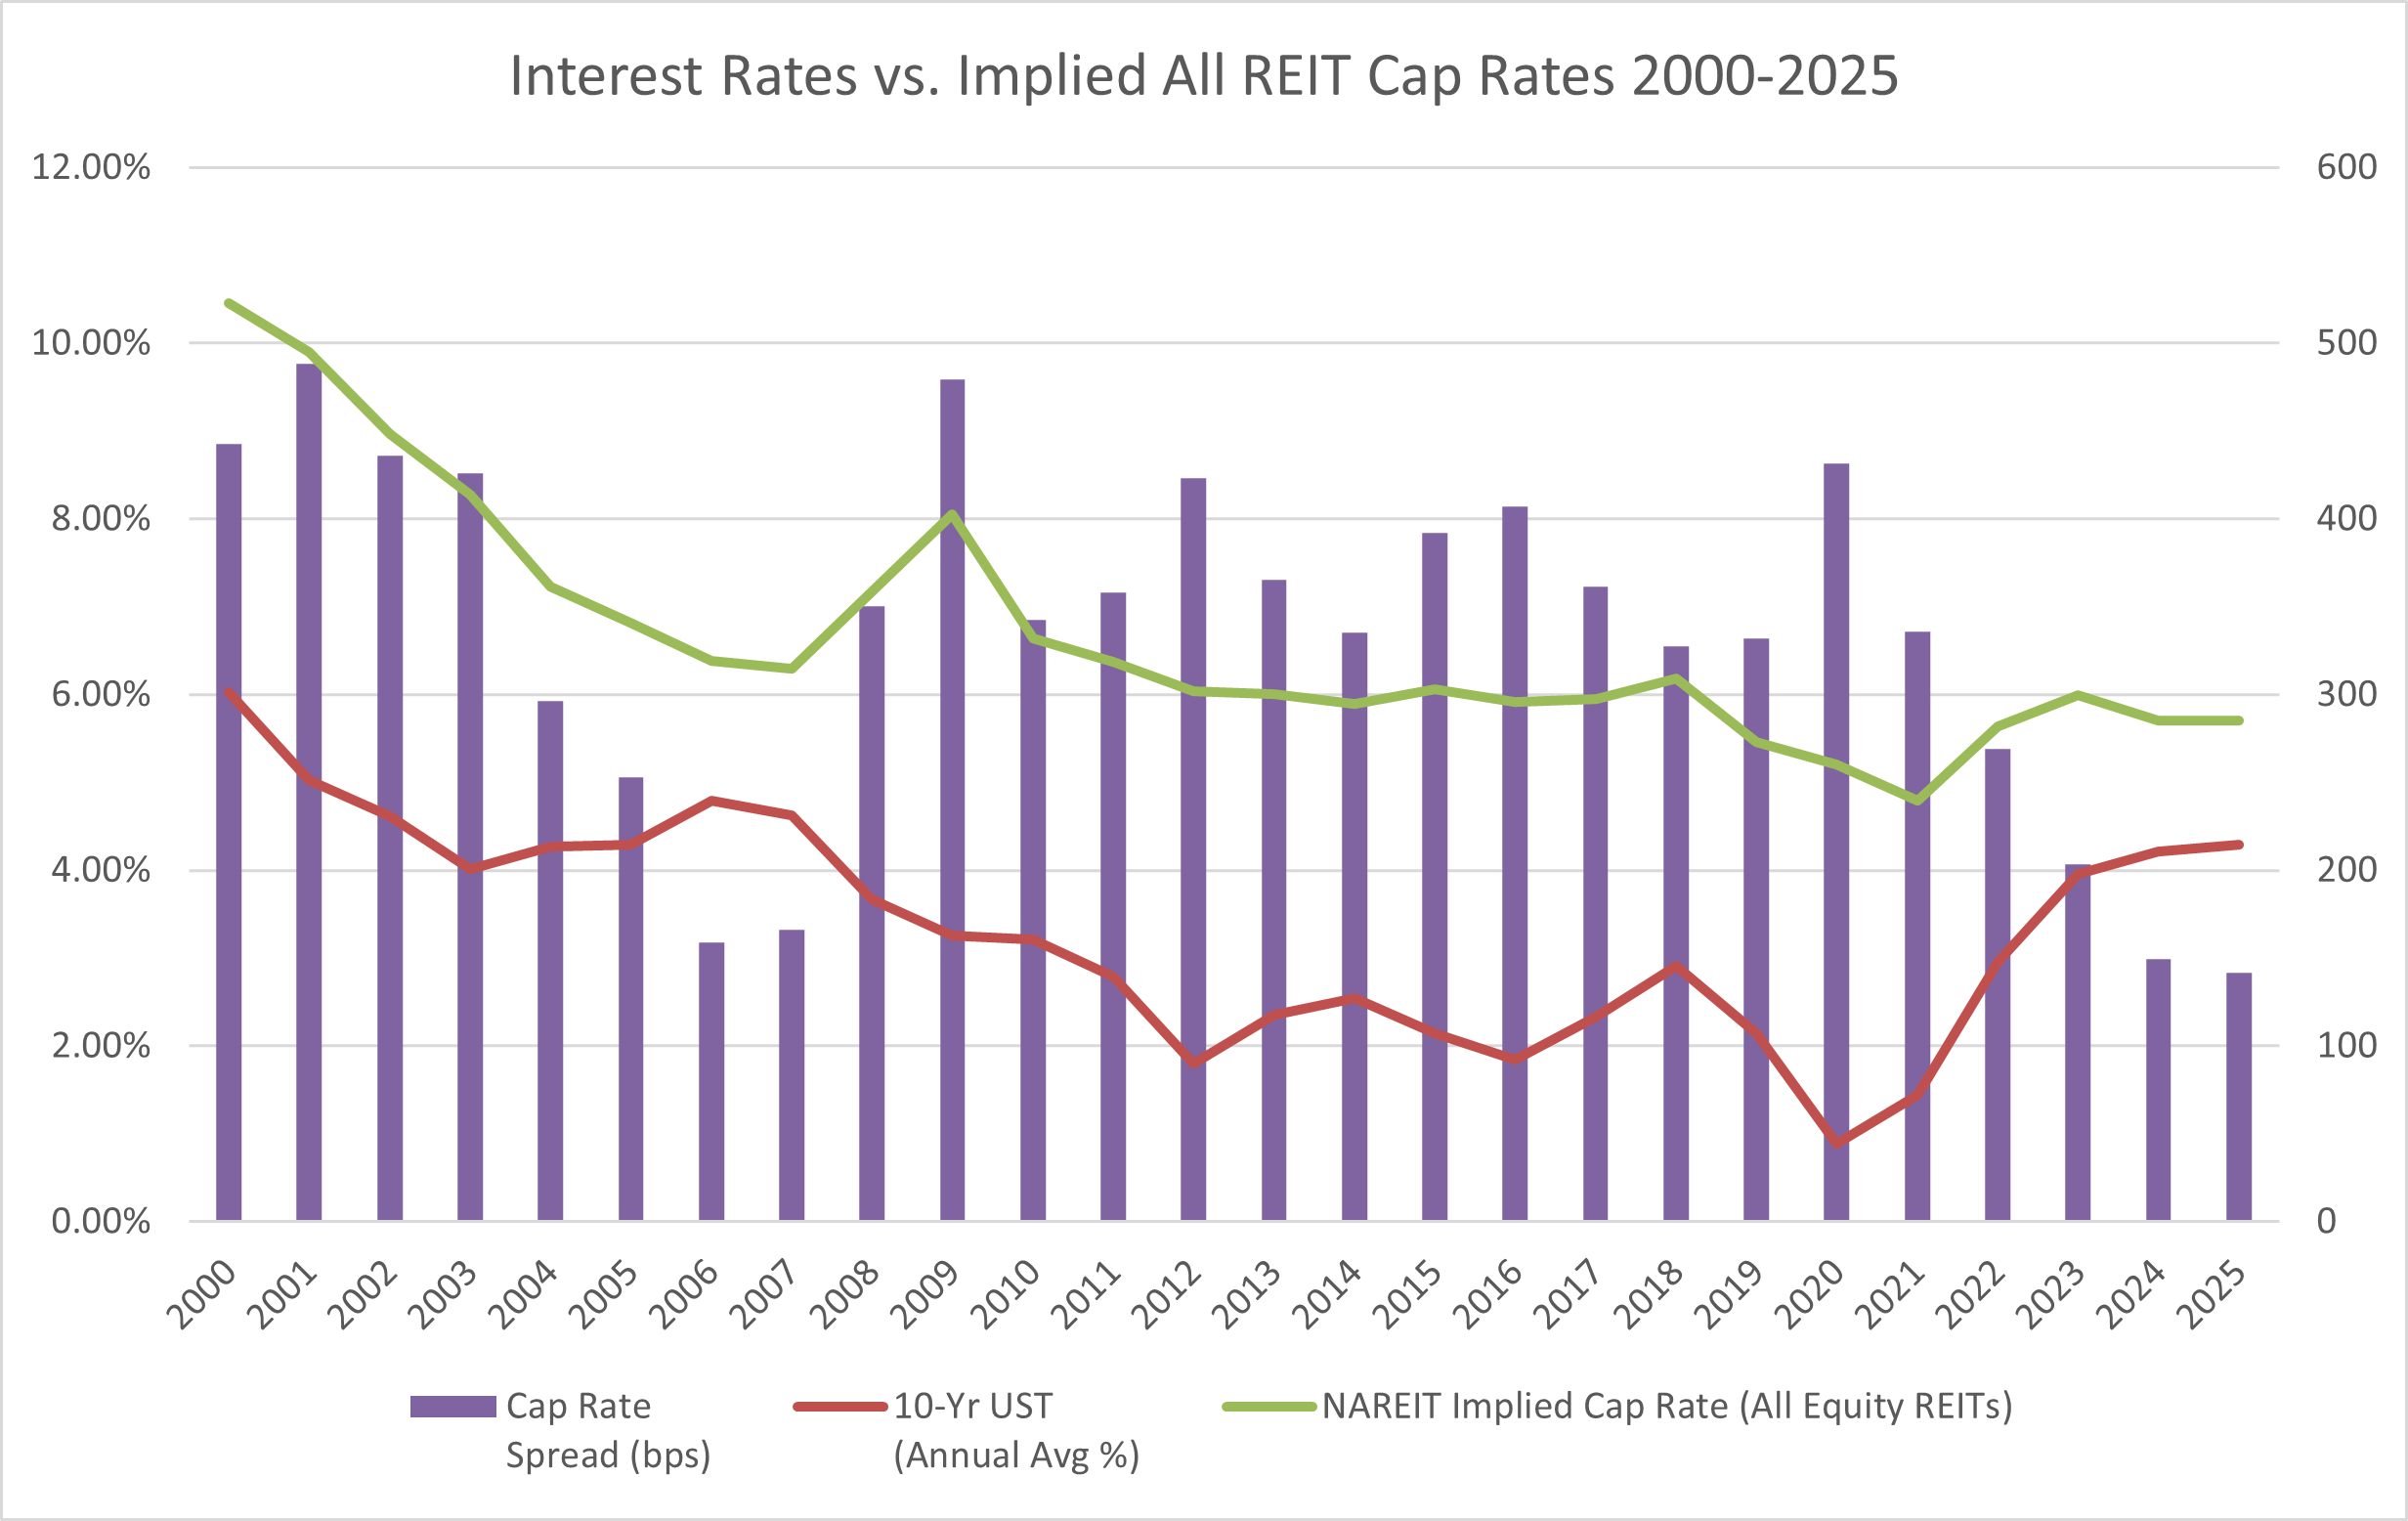
Inflation and interest rates are the most directly influential economic factors on commercial real estate valuations and investment returns. Understanding the relationship between inflation, monetary and fiscal policy, treasury yields, cap rates, debt, and money supply is essential for understanding and projecting real estate values.

Inflation by Decade Cap Rates vs Interest Rates
Inflation by Decade: 1960s – Present
Four decades of disinflation (1980–2019) driven by globalization, technology, and demographics; 2020s reversal to 3.9% average signals structural shift with major CRE implications
Post-Pandemic Inflation Spike & Fed Response
CPI surged to 9.1% (June 2022); Fed hiked from 0% to 5.25–5.50%, fastest increase in 40 years; paused at 3.5–3.75% (Jan 2026)
Inflation by Category: Breaking Down the Headline Number
Services inflation (+101% since 2000) driven by labor costs in healthcare, hospitality, and construction; goods inflation volatile but mean-reverting; construction PPI up 38–48% vs. 25% CPI since 2019; OER shelter lag debate; sector wage analysis and demographic connections
Multifamily Cap Rates vs. Interest Rates
Cap rates track 10-Year UST with a two-year lag (84% correlation); spreads range from 145 bps (exuberance) to 457 bps (crisis), averaging 312 bps from 2000–2025
Money Supply & Other Inflation Factors
M2 growth correlated with CPI at a ~2-year lag from 1960–1999 (R = +0.41), broke down during 2000–2019 (R = −0.08) as disinflationary forces dominated, then reasserted dramatically during the pandemic (R = +0.86)
U.S. National Debt vs. GDP Growth
Federal debt hit $35.5T (121% of GDP) in FY2024; debt grew 6.9% vs. 5.7% nominal GDP growth; the debasement trade accelerates as gold surges past $5,000 while Bitcoin crashes 47% from its October 2025 peak

Key Data Sources & Research

Federal Reserve (FRED)
fred.stlouisfed.org - Interest rates, money supply, inflation data
U.S. Bureau of Labor Statistics
www.bls.gov - CPI, employment, wage data
Federal Reserve Board
www.federalreserve.gov - FOMC statements, Powell press conferences
U.S. Treasury Department
www.treasury.gov - Debt data, bond yields
NCREIF / RCA
Cap rate data, transaction volumes by asset type
Cleveland Fed Inflation Nowcasting
www.clevelandfed.org - Real-time inflation estimates